Data centre construction in Australia: building a US$70 billion pipeline with a workforce that doesn’t exist yet

The trades needed to build Australia’s data centre pipeline aren’t available to hire. That leaves three levers: how many skilled hours each task consumes, how long an error survives before someone finds it, and what the resulting disruption does to safety.

A situation most people on a data centre job will recognise: A design clarification comes through late, and the dimensional tolerances between the structural steel and the precast elements are ambiguous. Two teams read it differently. Work continues on both sides of the interface. Nobody knows there is a problem until the components meet and don’t fit. 

Nothing unusual happened here, and no one was careless. The information was late and imperfect, which is normal, and the misalignment stayed invisible until installation, which is also normal. What varies between projects isn’t whether this occurs, but how long it takes to surface and what happens next. 

That is the interesting question for the next four years of data centre construction in Australia, because the traditional answer — put more people on it — is not available. 
In short

US$3.6B →
US$6.7B
Forecast Australian data centre construction output, 2026 to 2030, against an active pipeline of about US$70.2 billion.
13,000
Additional energy trades workers needed by 2030 — drawn from a pool already at a 60% shortage for electricians.
≈30,000
Worker-equivalent unlocked by a 5% construction productivity gain.
0.18%
Mean cost of non-conformances as a share of contract value — concentrated in rare, expensive events, mostly steel and concrete.
Rework ↑ Injury
Rework raises injury exposure, which makes verification a safety argument as well as a quality one.

Australia’s data centre construction pipeline

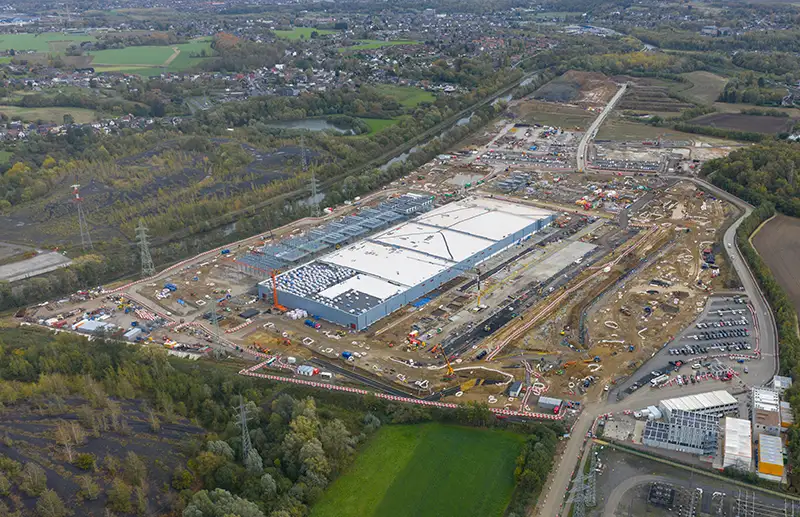
Australian data centre construction output is forecast to rise from roughly US$3.6 billion in 2026 to US$6.7 billion by 2030, with annual growth accelerating from 12.9% this year to 17.7% by the end of the decade. The active project pipeline sits at around US$70.2 billion — New South Wales US$38.4 billion, Victoria US$15.1 billion, Tasmania US$10.0 billion. 

Roughly 71% of that is still in pre-planning or planning, with US$13.9 billion in execution — so most of this work hasn’t started, and the delivery question is still open. 

Active pipeline by state

Active pipeline by state

US$ billions, active projects

New South Wales
New South Wales · $38.4B
$38.4B
Victoria
Victoria · $15.1B
$15.1B
Tasmania
Tasmania · $10.0B
$10.0B
Other states
Other states · ~$6.7B
~$6.7B

Pre-planning / planning

71%

Of the US$70.2B pipeline hasn't reached execution — the delivery model for most of this work is still being decided.

In execution

US$13.9B

Currently under active construction — a fraction of what's coming, and the leading edge of the workforce problem.

The construction workforce shortage behind the pipeline

The Powering Skills Organisation’s 2026 workforce plan puts the requirement at roughly 13,000 additional energy trades workers by 2030 — close to double the current sector workforce. 

The starting position is poor. Electricians sit at a 60% national shortage, air conditioning and refrigeration mechanics at 41%, electrical distribution trades at 70%, and more than half of energy employers cannot fill a role within six months. Structural trades are no easier, drawing on the same pool as housing, transport and transmission work. 

National shortage rate by trade

Share of roles employers cannot fill

Electrical distribution
70%
Electricians
60%
AC & refrigeration
41%
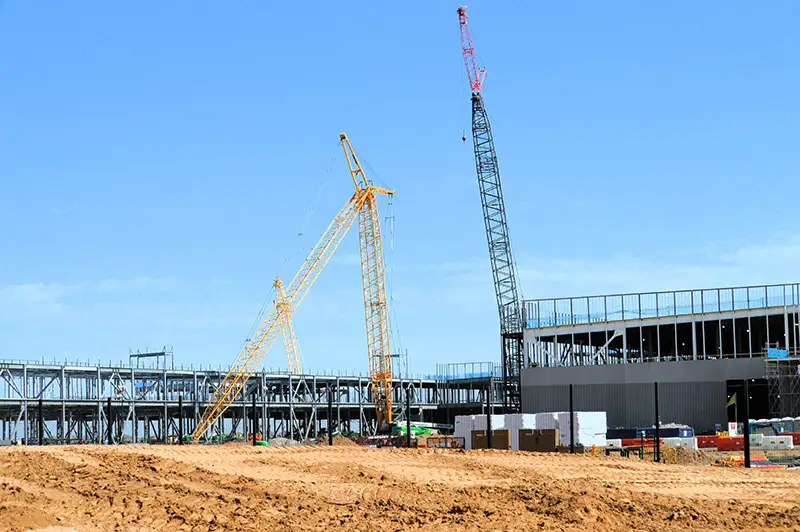
structural steel in data center construction

The Australian Government now expects new and expanded data centres to invest in Australian skills, and prioritises projects that do in Commonwealth assessments. Workforce has become an approvals question, not just a delivery one. 

The most useful number in the PSO report is not a shortage rate. It is that a five% productivity improvement across construction is equivalent to adding approximately 30,000 workers. If the people cannot be recruited at the rate the pipeline demands, productivity stops being a margin discussion and becomes the only lever left on programme.

Workers needed by 2030

13,000

Additional energy trades workers required, against a labour pool that's already short.

5% productivity gain =

≈30,000

Worker-equivalent unlocked sector-wide — more than double what recruitment alone needs to find.

Three levers

With recruitment off the table at the scale the pipeline needs, the capacity has to come from how the work itself is done. Three levers do the heavy lifting.

LEVER ONE

Setout hours in MEP services

Data centres are services-dense buildings. The electrical, mechanical, hydraulic and fire packages carry a disproportionate share of the labour, and a disproportionate share of the setting out. 

Much of that setting out is still done the way it has always been done — two people, a tape, a string line, a scissor lift and a drawing that may or may not reflect the current coordinated model. Framing, hangers and brackets, penetrations, containment routes, plant bases: skilled trades hours spent transferring dimensions from paper to concrete. 

Robotic total stations driven from the model do that work with fewer people, in less time, from a single source of geometry. This is a claim about labour hours rather than error rates, and in a market that cannot recruit, labour hours are the bottleneck. It is also the argument that requires the least persuasion, because installation teams who have used the tools tend to be the ones asking for them. 

LEVER TWO

Where rework cost actually concentrates

Love, Teo and Morrison analysed 7,082 non-conformances borne by an Australian contractor across 218 projects over a decade — actual costs drawn from project records rather than estimates. The mean cost to the contractor was 0.18% of the original contract value. 

Two things stop 0.18% from being the end of the argument, and the first is distribution. Cost concentrates in a small number of large events: in that dataset, non-conformances above AU$100,000 represented well under 1% of occurrences but around a third of total cost. The same body of research documents senior managers suppressing reports above that value, so the tail is more likely understated than overstated. 

The second is indirect cost — idle time, waiting, transport, resequencing and disruption to following trades, all of it rarely captured. One tentative estimate puts it at up to six times the direct figure. 

The trade breakdown points somewhere specific. The highest-cost non-conformances sat with structural steelwork at 34% and concrete at 21%, with pipework at 10%. Among the concrete issues: incorrect finished levels, out-of-tolerance work, and errors leading to incorrect setout — including a pour finishing 17mm short on as-built level and holding up following trades. Among the steel issues: bolt and cleat position, orientation, centre and hole-size errors, and fabricators working from superseded drawing revisions. 

Highest-cost non-conformances, by trade

Love, Teo & Morrison (2018) — 7,082 non-conformances, 218 projects

Structural steel
34%
Concrete
21%
Pipework
10%
Electrical
7%

For a data centre programme that means tilt panel cast-ins and ferrules, post-tensioned slab penetrations and anchors, holding-down bolt arrays and baseplates. These are the elements where an error is expensive to remediate and hard to see until something else fails to fit. 

The second contributor to non-conformance cost in that research, at 18.8%, was failure of inspection and test plans and process control — and that is where reality capture earns its place. An ITP is a hold point: work is verified before the next activity proceeds. Scanning a slab before pour, checking a cast-in array against the model, or verifying a steel frame before follow-on trades commit all shorten the interval between an error occurring and someone finding it, and against a cost distribution this concentrated, that interval is where the return sits. It is a detection argument rather than a prevention one.

LEVER THREE

The link between rework and safety incidents

The association between rework and injuries is strong, and it gets less attention than it deserves. 

Performing rework raises the likelihood of someone getting hurt, because work happens out of sequence, under time pressure, often in conditions that were not planned for. Anyone who has run a site recognises this: it is rarely the planned high-risk activity that produces the incident, it is the unplanned one. 

There is a structural reason this matters commercially. Both quality and safety are regulated, but they are enforced differently. Safety carries personal liability, a regulator that can stop work on the day, and mandated roles and reporting inside the project. Quality obligations tend to bite at certification, or in litigation years after handover. So, safety gets resourced first, and quality ends up subordinate — managed by different people, against different budgets, with different levels of scrutiny. 

If reducing rework also reduces injury exposure, then verification is a safety investment as well as a quality one — and it can be argued in front of a board that has already decided safety is non-negotiable. 

Why the American self-perform model doesn’t transfer

JE Dunn, a US general contractor of around 5,000 staff, models in Tekla, coordinates in Trimble Connect, sets out in FieldLink and verifies in the field with SiteVision. Rework associated with concrete layout across their self-perform work fell from US$2.1 million in 2022 to US$500,000 in 2024, with a reported zero for 2025 year to date. 

That is an illustration of a mature workflow rather than a benchmark, because the delivery model is different. JE Dunn could standardise because they self-perform — the concrete crews are their own people, so when the business decided the workflow was no longer optional, there was a workforce to apply that decision to. 

Australian head contractors do not generally work that way. Structure, façade and services are subcontracted, often to a dozen or more businesses, several of them working competing projects in the same corridor. There is no in-house workforce to standardise, because the builder does not employ the people doing the setting out. 

So the mechanism has to be different. A common setout and verification standard cannot emerge from the workforce here; it has to be specified — in the contract, in the project execution plan, before packages are let. 

Process and contract: what has to run the length of the delivery chain

A data centre is not one organisation with one culture. It is a chain: owner, head contractor, package contractor, subcontractor. Each interface is a separate commercial relationship, and each has its own reason to keep a problem inside its own boundary. 

Two things need to run the length of that chain. The first is process — the hold points, the tolerances, who verifies what and when — and this is the part that usually gets specified. 

The second is the commercial treatment of what verification finds. If raising a variance at a hold point still lands the cost on the party who raised it, the process becomes paperwork. People learn to find nothing, and the error travels down to the next trade, where it costs considerably more. 

Finding a problem early is worth little if the response is defensive, and having a quality system in place proves nothing — the procedures, inspections and non-conformance registers can all be there while nothing about the behaviour changes. 

That cuts both ways. A team willing to raise problems still needs something to raise: without verification, a 17mm discrepancy is just an opinion, and opinions lose to programme pressure. Detection produces the evidence. What the contract and the culture do with that evidence decides whether it was worth producing. 

Technology strengthens detection, and what that is worth depends on conditions the owner and head contractor control. Conformance, specification and control remain the foundation; this is the layer that sits on top of them. 

Data centre campuses are built in stages

Australian data centre owners are not building a facility. They are building campuses, in stages, over years, often with the same head contractor and frequently with the same installing trades moving between stages. 

Project-level decision

Resets to zero

The gain evaporates at practical completion — the next stage starts with a different team, a different control network, and the same lessons to relearn.

Programme-level decision

Compounds

Stage two inherits stage one's model, control network and as-built record. Every handover adds to what the next stage starts with.

Every handover is either a compounding advantage or a reset to zero. 

What to specify at programme level

Three things, once, before packages are let.

01

Setout methodology & control

A single site control network, model-driven setout, and defined responsibility for maintaining it across trades and stages.

02

Verification at hold points

Which ITPs require dimensional verification, at what tolerance, in what format, and who reviews the result before the hold point is released — plus the commercial treatment of what's found.

03

As-built capture & handover

What is captured, to what accuracy, and in what state it passes to the next stage — so the record is an asset rather than a closeout obligation.

What BuildingPoint Australia supplies against

BuildingPoint Australia is the Trimble distributor for building construction field systems across Australia. Those three specify items map directly onto hardware and software already deployed on Australian sites.

Maps to 01 — Setout Methodology & Control

Trimble Ri Robotic Total Station + GNSS (R780)

Model-driven layout run from a single coordinated source of geometry, tied to a GNSS-established site control network that carries across trades and stages rather than being recalibrated project by project.

Trimble Ri →

Maps to 02 — Verification at Hold Points

Trimble SiteVision

AR and LiDAR verification at the point of work — overlaying the coordinated model on the physical site so a hold point can be checked against design intent before the next trade commits.

Trimble SiteVision →

Maps to 03 — As-Built Capture & Handover

Trimble X9 Laser Scanner + RealWorks

Survey-grade point cloud capture that becomes a stage's as-built record — the asset the next stage of a multi-year campus inherits, rather than a closeout report nobody opens again.

Trimble X9 →

Maps to 04 — Project & Site Management

ProjectSight

Cloud-based construction project management that connects field and office teams — real-time document control, drawings, RFIs, defect tracking, and daily reporting powered by Trimble Connect.

ProjectSight →

The workforce is not coming. The pipeline is not slowing down. The capacity has to be found in the work itself.

Common questions

Around US$70.2 billion in active projects, with New South Wales at US$38.4 billion, Victoria at US$15.1 billion and Tasmania at US$10.0 billion. Annual construction output is forecast to reach US$6.7 billion by 2030. 

Setting out positions on site directly from the coordinated model using a robotic total station, rather than measuring from drawings with tapes and string lines. It reduces the number of skilled trades hours a setout task consumes and removes the transcription step between model and field. 

Research based on actual project records from an Australian contractor found a mean non-conformance cost of 0.18% of contract value. That figure understates the exposure: cost concentrates in rare high-value events, indirect costs are rarely captured, and reporting of large non-conformances is known to be suppressed. 

In that dataset, structural steelwork accounted for 34% of the highest-cost non-conformances and concrete 21%, with pipework at 10% and electrical at 7%. The expensive errors sit in the structure, not the services. 

No. It shortens the time between an error occurring and someone finding it. Against a cost distribution where a small number of events carry most of the cost, that interval is what determines the size of the loss. 

US general contractors that self-perform employ the crews doing the work, so they can standardise a workflow by deciding to. Australian head contractors subcontract structure and services, so a common standard has to be specified contractually rather than adopted internally. 

BuildingPoint Australia is the Trimble distributor for building construction field systems across Australia. 

Two things we can do for a data centre programme:

  1. Review a draft project execution plan against the three items above and tell you where the gaps are.
  2. Run the verification workflow on a live slab or steel frame on one of your current jobs, so you can judge the interval it saves rather than take our word for it.

    Either can be facilitated by the national BuildingPoint hardware team.
     

Aaron Cartridge helps construction professionals leverage field technology to improve productivity, collaboration, and project outcomes as BuildingPoint Australia’s Field Solutions Segment Manager. With 29+ years of construction industry experience and a practical understanding of construction workflows, he provides account management, technical expertise, and consultancy across BuildingPoint’s field solutions portfolio.

Aaron Cartridge BuildingPoint Australia Field Solutions

Sources 

  • GlobalData, Global Data Center Construction (July 2026) — Australian output forecasts, pipeline and state distribution. Figures in USD. 
  • Australian Government, 2026 national expectations for data centres and AI infrastructure. 

Want to know more about our products? Talk to an expert

Fill out the form below to get in contact with one of our sales experts, or call to chat with our team.

Tech Support: If you are looking for Product Tech Support please do not use this form. Please visit our Support Page to contact us for support questions.